
Crypto Journalist
Anas Hassan
Crypto Journalist
Anas Hassan
Share


An ancient Bitcoin whale has emerged from a 14-year slumber, transferring 3,962 BTC valued at $469 million after conducting an initial test transaction of 0.00184 BTC ($218.59).
According to Bitinfocharts data, this wallet originally received 3,962 BTC in January 2011 when Bitcoin traded at just $0.37, making the initial investment worth approximately $1,453. Today, this holding represents a substantial return on investment.
Market observers are now debating whether this movement indicates preparation for a massive sell-off or simply represents nostalgic portfolio management from the early Bitcoin era.
Ancient Bitcoin Whales and Institutional Buyers Countertrade as Bitcoin Consolidates
Many analysts have linked Bitcoin’s recent price consolidation below $120,000 to increased selling pressure from long-term holders who accumulated the cryptocurrency during its earliest days.
Just six days prior, Cryptonews documented another ancient Bitcoin whale liquidating their complete holdings of 80,202 BTC after a 14-year dormancy period, generating approximately $9.53 billion in proceeds.
Beyond retail profit-taking and ETF outflows, Satoshi-era wallets appear to be capitalizing on their decade-plus patience as Bitcoin has established new all-time highs above $123,000.
Glassnode analysis reveals that Bitcoin’s sharp rally from $110,000 to $117,000 has created an on-chain air gap, a low-density accumulation zone.
Should current support fail, historical patterns suggest such gaps could develop into bottom formation zones.
While some ancient whales are liquidating their Bitcoin reserves, creating downward price pressure, institutional investors and sophisticated market participants are actively absorbing the supply by purchasing during price dips.
On July 24, leading asset manager BlackRock acquired an additional 1,204 Bitcoin, expanding its total holdings to 737,000 BTC.
Bitcoin treasury companies have also emerged as particularly aggressive buyers over the past two weeks.
Michael Saylor’s Strategy recently acquired 4,225 additional BTC, bringing its total Bitcoin reserves to 601,550 BTC.
Additional companies, including Metaplanet, Trump Media, MARA, H100 Group, Swedish gaming company Fragbite Group, Refine Group AB, Figma, and Japanese AI firm Quantum Solutions, have recently implemented Bitcoin treasury strategies.
This institutional buying activity has reinforced investor confidence in Bitcoin’s potential recovery and subsequent rally to new highs.
Crypto analyst Ted Pillows remains optimistic, noting that the U.S. stock market rally, with the S&P 500 reaching new highs, could provide tailwinds for Bitcoin.
He projects BTC will surpass $130,000 in Q3 before experiencing any correction.
Technical Analysis: Bullish Structure Intact
The BTC/USDT daily chart on Binance demonstrates the continuation of a bullish market structure.
The price formed two distinct double-bottom patterns in June, both followed by substantial upward movements generating gains of approximately 9.77% and 20.72% respectively.
These bullish reversals from established demand zones indicate strengthening buyer conviction, with each bottom leading to progressively higher highs.
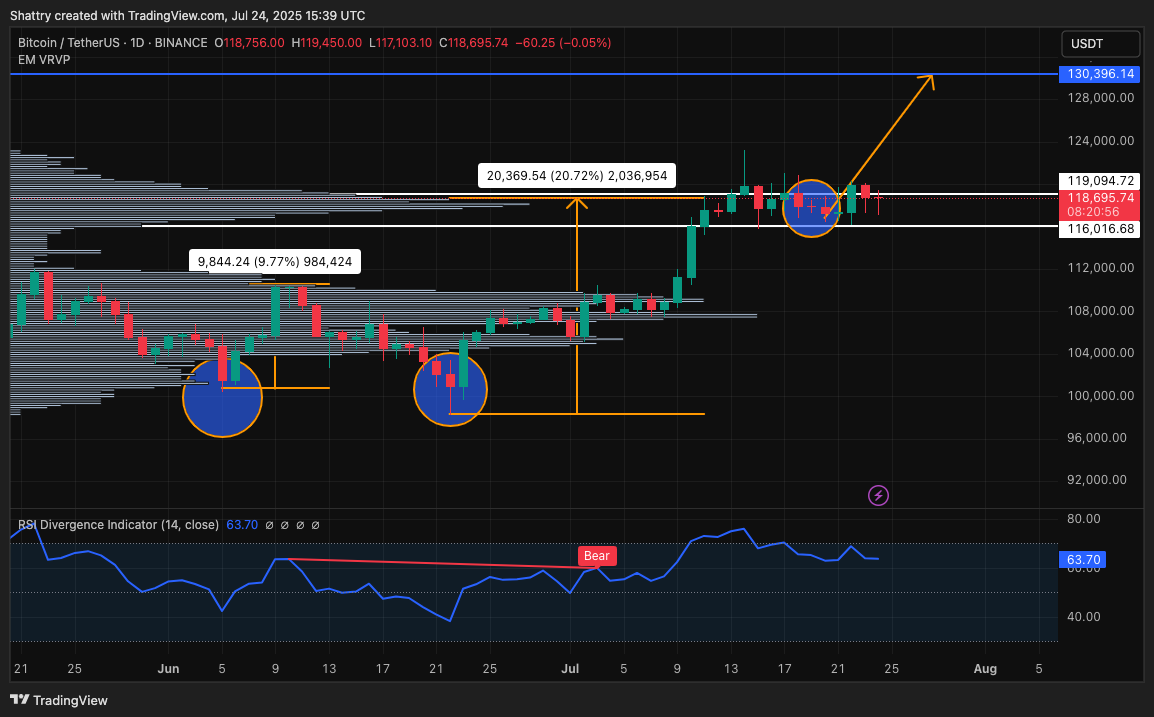
Currently, Bitcoin trades within a $116,000-$119,000 range following the latest rally, with clear price absorption occurring around the $118,000-$119,000 level. This sideways movement suggests a temporary consolidation or accumulation phase.
The Relative Strength Index (RSI) hovers around 63.70, remaining in bullish territory while showing a slight decline.
Volume Profile analysis (EM VRVP) reveals strong market interest and liquidity concentrated between $106,000 and $116,000, establishing this region as a robust support foundation.
The most recent consolidation phase remains intact above the key $116,000 support threshold.
Given the pattern of consolidation following each rally and the formation of higher lows over time, the market structure favors bullish continuation.
Should the price maintain support above the $116,000-$119,000 range, a breakout above resistance could target the $130,396 level as indicated by chart projections.
However, failure to hold the $116,000 support zone could trigger a retest of the $112,000 area, though the overall bullish structure would likely remain intact.