
Author
Jimmy Aki
Author
Jimmy Aki
Share


Arbitrum ($ARB) rockets 9% today, leaving rival Ethereum L2s in the dust as buyers rush to recover from May’s 16% collapse. The token, now trading at $0.37, has pumped by 50% since bottoming at $0.242 in April.
The rally puts $ARB at an inflection point—either powering through resistance or facing another rejection in the hyper-competitive L2 arena.
Uniswap and Aave Choose Arbitrum—Is $ARB the Next L2 Leader?
With Ethereum also showing positive momentum, many traders anticipate that layer-2 solutions will once again dominate the narrative, potentially driving a substantial $ARB surge in the coming weeks.
Several factors underpin the widespread belief that $ARB could see a major pump:
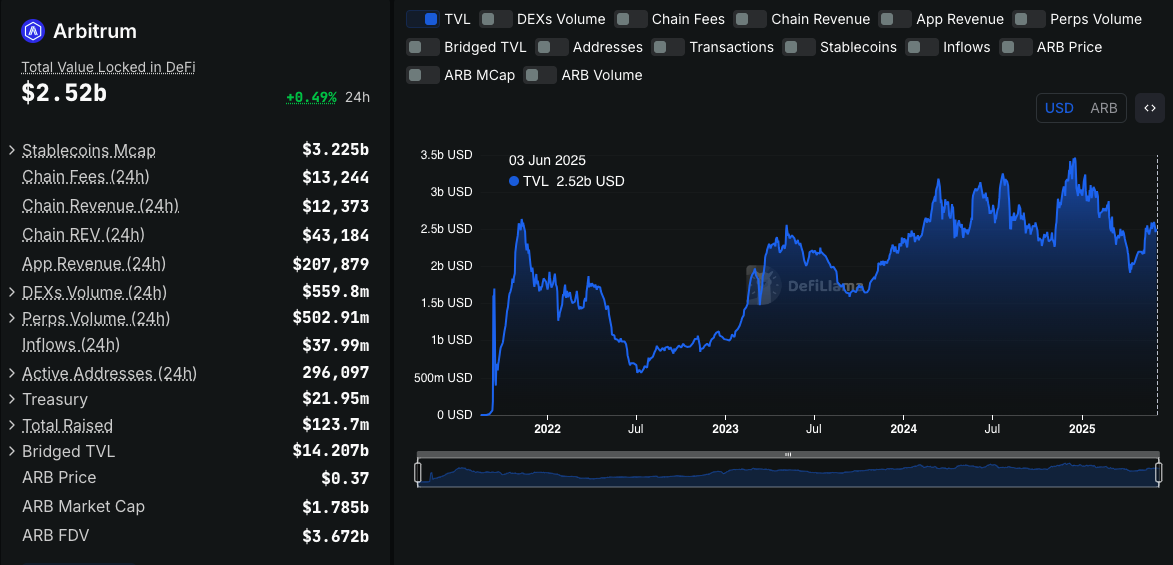
Firstly, Arbitrum has recently surpassed $2.5 billion in total value locked (TVL), with a consistent average daily DEX volume of approximately $200 million.
In addition, leading Ethereum protocols such as Uniswap (DEX) and Aave (lending platform) have established Arbitrum as a primary hub for DeFi activities, with a large portion of their transactions routed via the Arbitrum bridge.
According to KaitoAI data, Arbitrum commands over 26% mindshare among layer-2 protocols, far ahead of competitors like Abstract (10%) and Base (8%).
In comparison to Polygon and Aptos, which maintain an average TVL of around $1.1 billion, Arbitrum’s TVL is more than double, yet its market valuation remains comparatively lower.
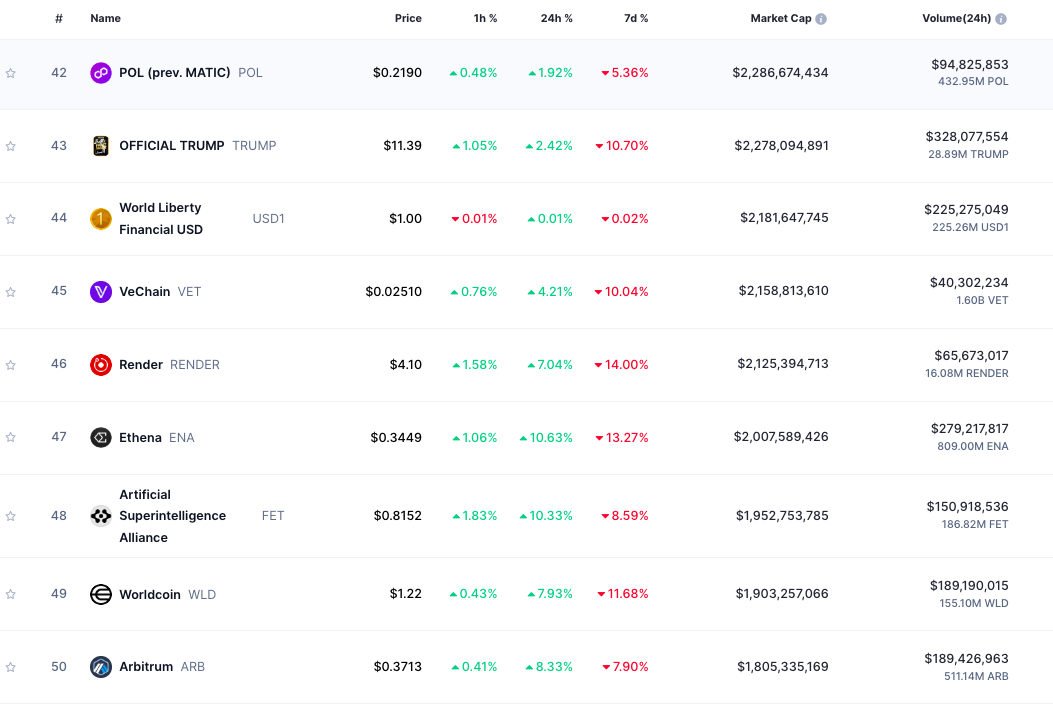
Currently, Arbitrum’s market capitalization stands at approximately $1.8 billion, while Polygon and Aptos are valued at $2.2 billion and $3.15 billion, respectively.
This gap between price and utility has fueled the conviction that Arbitrum is due for a sustained upward trend.
Crypto Analysts Predict $ARB at $3—Can This Cycle Deliver?
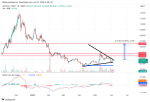
On May 29, prominent crypto indicator account @VipRoseTr shared an $ARB chart showing a double-bottom formation, projecting potential price targets of $1.6, then $2.2, with a peak at $3 during this cycle.
Another trader stated that “$ARB looks promising. Anticipating a huge breakout with a 30% to 45% bullish rally in the short term.”
While price action remains somewhat subdued, the Arbitrum Foundation continues to enhance the network’s utility.
Recently, Bando, a crypto checkout application, launched on Arbitrum, allowing users to pay for services such as Uber, Amazon, subscriptions, and gift cards using crypto, with near-instant transactions through the layer-2 network.
Data from Dune Analytics also shows that Arbitrum is more than just a platform for DeFi, payments, and gaming; it has attracted institutional interest, with over $260 million in real-world assets (RWAs) tokenized on Arbitrum to date.
Key Support Holds as $ARB Trades Within Symmetrical Triangle Pattern
Technically, the $ARB/USDT pair is trading near $0.3690, having rebounded off a key support trendline around $0.30 that has held since early April.
The price action forms a symmetrical triangle pattern, characterized by a descending upper trendline and an ascending lower trendline, converging toward a breakout point.
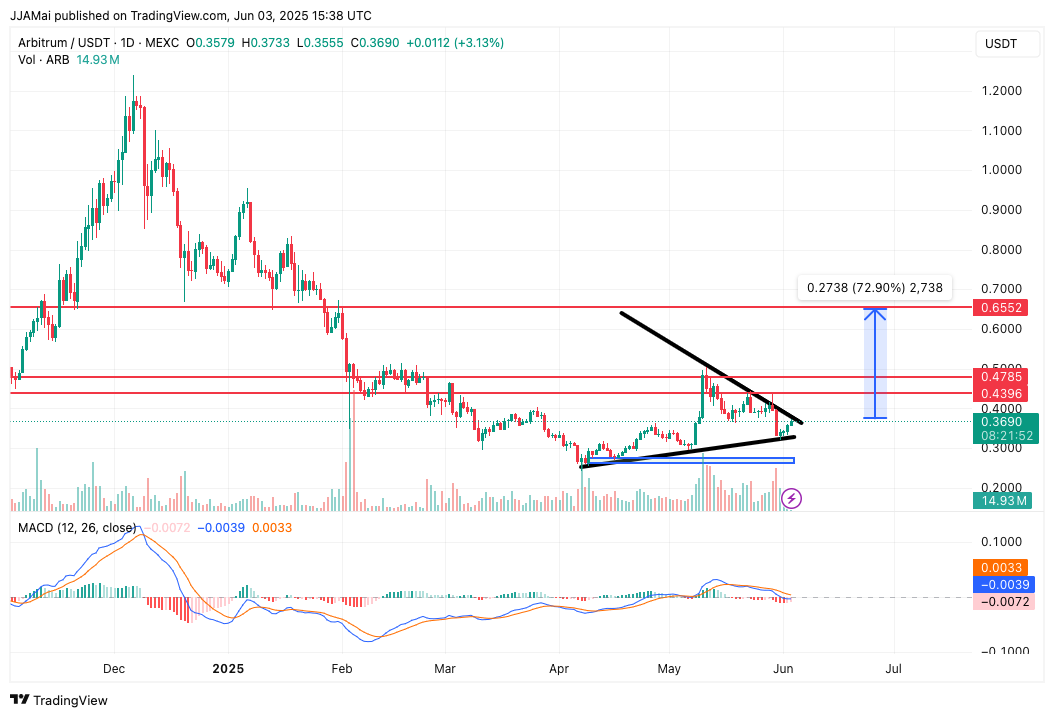
This pattern often indicates a continuation of the prevailing trend—in this case, bullish—provided that upward momentum resumes.
The MACD indicator suggests a potential bullish crossover as the blue MACD line curls upward toward the orange indicator line, implying bearish momentum may be diminishing and a reversal could be imminent.
A break above the upper resistance zone, particularly between $0.4396 and $0.4785, would confirm a breakout.
If this breakout unfolds, the next resistance target could be around $0.6552, representing roughly a 73% upside from current levels.
Conversely, failure to maintain support above the lower trendline could see $ARB retracing toward the $0.30 to $0.25 support range.