
Crypto Writer
Arslan Butt
Crypto Writer
Arslan Butt
Share


Bitcoin is trading around $95,775, down nearly 7% this week, as the broader crypto market slips into one of its most fragile sentiment phases of the year. The Crypto Fear & Greed Index has collapsed to 10, marking “Extreme Fear” and matching levels last seen in early March.
That shift alone is enough to make even long-term traders pause, especially as market cap has dropped to $1.91tn and momentum indicators continue to soften.
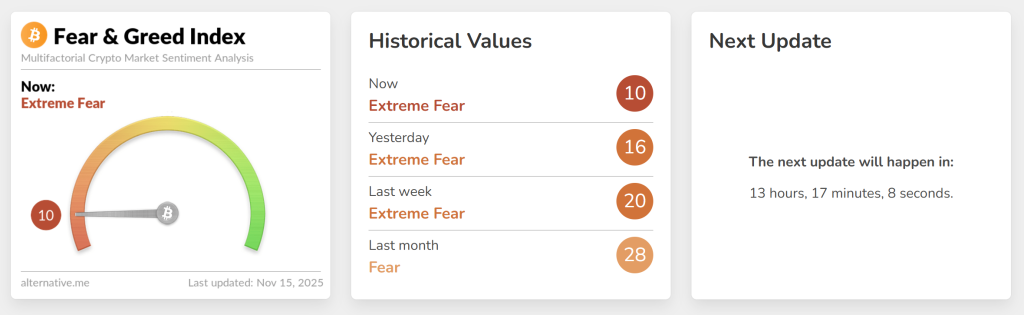
Historically, extreme fear has tended to act as a contrarian signal, often showing up near key accumulation zones, but this time the technical structure isn’t offering a clear verdict.
Bitcoin has slipped below its long-term ascending trendline for the first time since spring, signaling a break in the rhythm that carried the market through most of 2024 and 2025.
Bitcoin (BTC/USD) Technical Picture at a Crossroads
Bitcoin is stabilising after a sharp decline that dragged the market into the $94,500–$92,000 support region, an area that served as a pivot throughout April and May. Thursday’s long lower wick suggests buyers stepped in, but the follow-through has been timid.
The 20-EMA has rolled over, acting as dynamic resistance, while the RSI sits near 33, hovering above oversold territory without forming a clear bullish divergence.
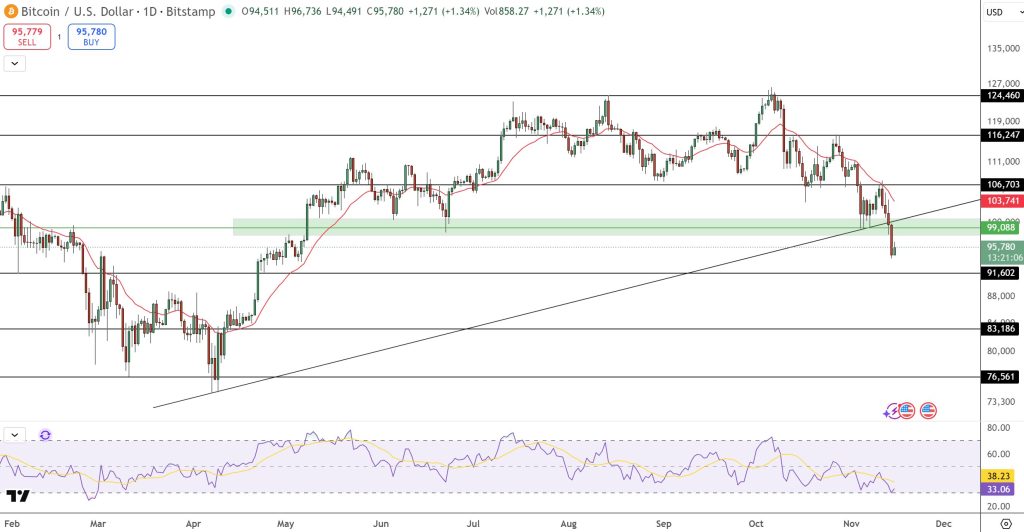
Candlestick behaviour reinforces the uncertainty. This week’s pattern resembles a smaller version of a three black crows sequence, followed by a single rejection candle, not quite enough to signal capitulation, but enough to slow the decline. Price is now squeezed between the broken trendline above and a mid-range floor below, a zone where markets usually make quick decisions.
Key Levels to Watch
A shift in momentum requires evidence. Traders are watching:
- $99,000 – First sign buyers are regaining control
- $103,700 – The broken trendline; reclaiming it would reset momentum
- $92,000 – Breakdown level that exposes deeper support
- $83,000 – Large liquidity pocket and next major downside target
A daily close above $99,000 would confirm a short-term reversal, especially if accompanied by a bullish engulfing candle and an RSI above 40.
Is This an Accumulation Bottom?
Extreme fear can create opportunity, but it can also precede another wave of selling. With Bitcoin stuck between conflicting signals – oversold momentum vs. broken structure, traders are approaching this zone cautiously. If buyers defend $92,000, this could evolve into a classic accumulation pocket. If not, the market may revisit deeper supports before stability returns.
Bitcoin Hyper: The Next Evolution of BTC on Solana?
Bitcoin Hyper ($HYPER) is bringing a new phase to the Bitcoin ecosystem. While BTC remains the gold standard for security, Bitcoin Hyper adds what it always lacked: Solana-level speed. The result: lightning-fast, low-cost smart contracts, decentralized apps, and even meme coin creation, all secured by Bitcoin.

Audited by Consult, the project emphasizes trust and scalability as adoption builds. And momentum is already strong. The presale has surpassed $27 million, with tokens priced at just $0.013265 before the next increase.
As Bitcoin activity climbs and demand for efficient BTC-based apps rises, Bitcoin Hyper stands out as the bridge uniting two of crypto’s biggest ecosystems. If Bitcoin built the foundation, Bitcoin Hyper could make it fast, flexible, and fun again.
Click Here to Participate in the Presale