
Crypto Journalist
Anas Hassan
Crypto Journalist
Anas Hassan
Share


Bitcoin (BTC) has officially hit a new all-time high of $111,999, surpassing its previous peak set on May 22, 2025.
The milestone marks the beginning of what many analysts are calling a new crypto bull market, fueled by growing institutional interest and a resurgence in retail demand.
Over the past few weeks, institutional interest in crypto assets has been growing steadily, according to reports by CoinShares.
US Spot Bitcoin ETFs recorded $80.08 million in daily net inflows as of July 8, bringing the cumulative total net inflows to $49.94 billion, with total net assets reaching $136.75 billion, representing 6.33% of Bitcoin’s market cap, according to SoSoValue.
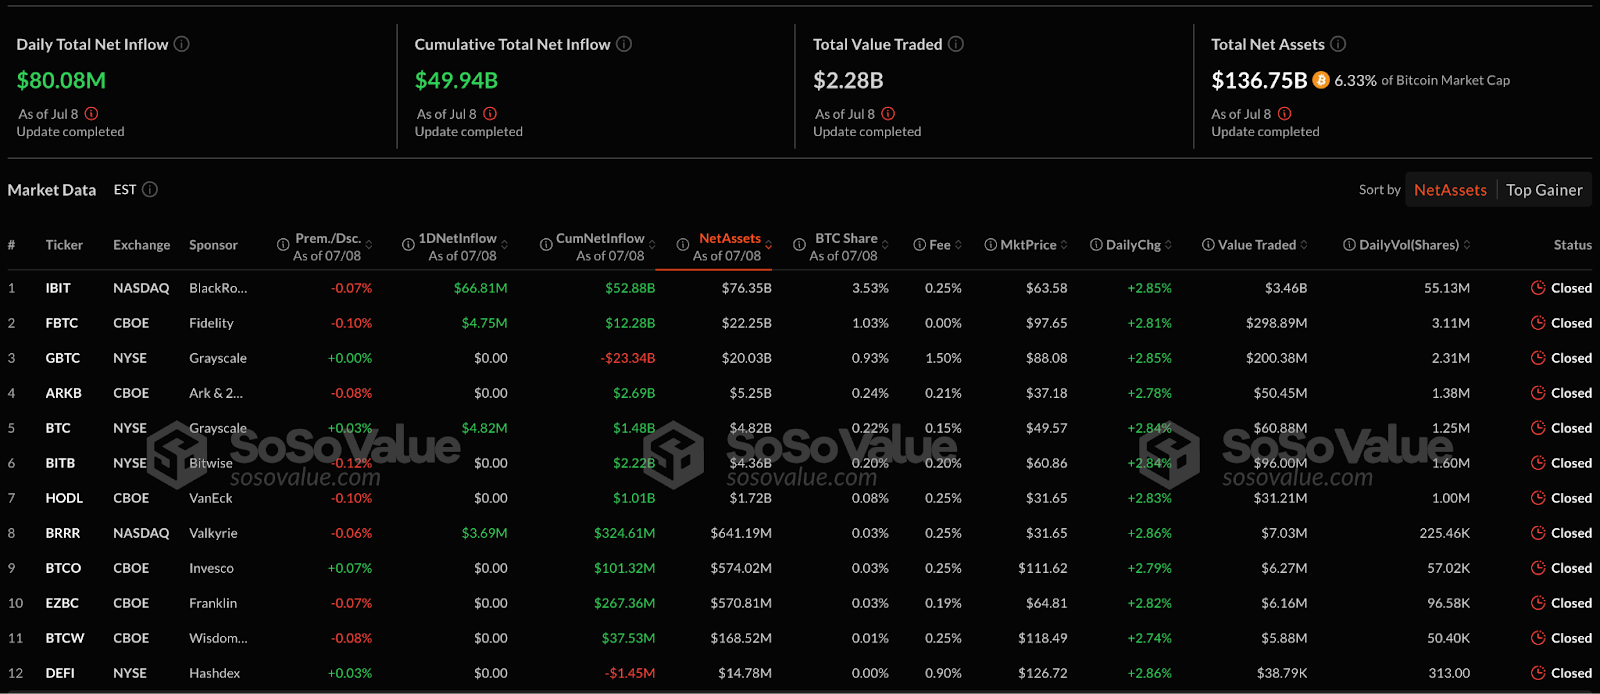
Source: SoSoValue
The surge coincides with unprecedented weakness in the US dollar, with the Dollar Index falling 10.1% year-to-date, marking its worst performance since 1973.
President Trump’s proposal for a historic 300 basis point interest rate cut, three times larger than the largest cut in history, has further pressured the dollar while driving institutional money into Bitcoin as a hedge.
Dollar weakness has created ideal conditions for risk assets, with speculative short positions on the US Dollar by asset managers reaching their lowest level since mid-2021.
The dollar index trades 6.5 points below its 200-day moving average, the largest margin in 21 years, creating unprecedented tailwinds for Bitcoin and other alternative assets.
Dollar Collapse Creates Perfect Storm for Bitcoin Rally
According to The Kobeissi Letter’s comprehensive breakdown, President Trump’s proposed 300-basis-point interest rate cut would trigger unprecedented monetary expansion, potentially saving $870 billion annually in debt service costs while sending shockwaves through financial markets.
An emergency-level intervention into a growing economy, with an annual growth rate of 3.8%, would likely push inflation above 5% while driving the dollar down an additional 10% from current levels.
Historical precedent warns against such aggressive monetary policy, as the Federal Reserve has never implemented cuts exceeding 75 basis points outside recession periods.
The March 2020 emergency cut of 100 basis points represented the previous record, occurring during the COVID-19 economic downturn rather than the expansion phase.

Source: The Kobeissi Letter
Kobeissi Letter analysis projects dramatic asset price inflation from potential rate cuts, with S&P 500 targeting 7,000+, oil reaching $80+ per barrel, and gold surging toward $5,000+ per ounce.
Home prices could rise an additional 25% despite mortgage rates falling from 7% to 4%, as price surges would offset the improvements in affordability.
The dollar’s weakness has already triggered a massive capital flight into alternative assets, with gold gaining 40% over the past 12 months and 80% over the past five years.
Bitcoin’s correlation with dollar weakness positions the cryptocurrency as a primary beneficiary of continued monetary debasement and currency depreciation.
In fact, between today and yesterday, Japanese energy consulting firm Remixpoint raised $215 million dedicated exclusively to Bitcoin investments, while Nasdaq-listed Murano Global announced $500 million in equity agreements earmarked for BTC purchases.
The corporate treasury revolution accelerates as companies seek protection from currency debasement and inflation hedges.
Bitcoin Technical Analysis Confirms Massive Breakout Pattern
Bitcoin’s 4-hour chart achieved a decisive breakthrough above $111,586, successfully clearing multiple resistance zones at $108,532, $109,745, and $110,773 before establishing new peaks.

Source: @CryptoGodJohn on X
The clean break above the previous all-time high zone, around $109,000 – $110,000, transforms these levels from resistance into potential support.
The technical structure operates in uncharted territory above $111,000, with the next major resistance appearing around $111,930 based on psychological round numbers.
The critical support line at $100,375 must hold to maintain bullish momentum, as failure below could indicate false breakout scenarios.
Furthermore, weekly chart analysis reveals a massive inverse head and shoulders pattern with neckline breakout projecting measured move targets to $132,500.

Source: @cryptoWZRD_ on X
The pattern represents institutional accumulation over months of consolidation, with higher lows in the right shoulder indicating strengthening buying pressure and momentum divergence.
Perpetual futures charts confirm range breakout above $112,000, which also validates bullish momentum with equal lows support at $107,249.
The daily fair value gap at $104,000 and demand zone at $102,000 represent key retest areas, though breakout strength favors continued upward momentum.
The clean nature of the breakout above $112,000, combined with a new all-time high, positions Bitcoin for a sustained bull market advance.
Primary targets include $120,000 initially, followed by the inverse head and shoulders projection toward $131,000-134,000, with any pullbacks to $109,000-110,000.