
Author
Ahmed Balaha
Author

Share


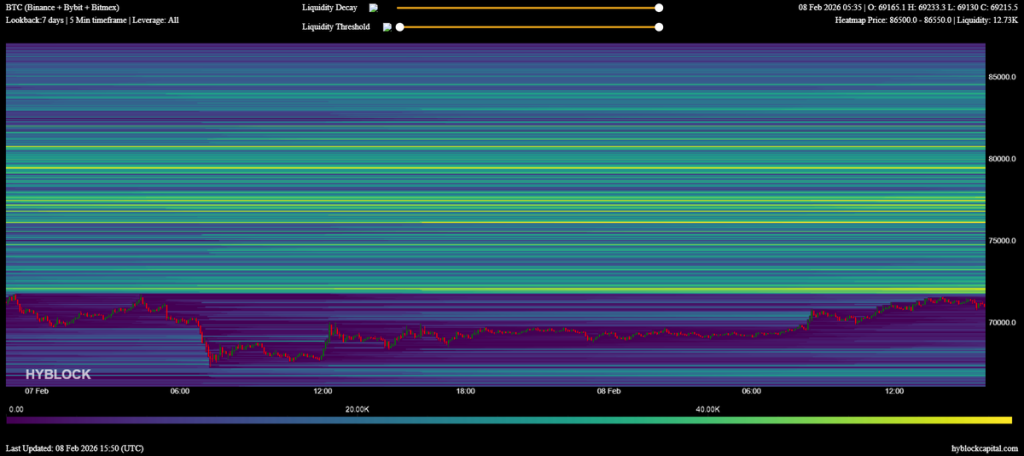
Bitcoin traders are glued to one price right now: $50,000.
After a brutal dip that saw prices flash below $60,000 for a hot minute, everyone’s wondering if we’ve finally hit rock bottom.
Yes, Bitcoin price bounced back above $70,000 temporarily, but here’s the thing, nobody’s really convinced this is “the bottom” just yet.
Key Takeaways
- Analysts warn the recent bounce to $71,000 may be a “bull trap” designed to liquidate shorts before a retest of $50,000 support.
- JPMorgan data indicates Bitcoin has traded below the estimated miner production cost of $87,000, a historical signal for capitulation.
- Technical patterns highlight critical support at $67,350, with a breakdown potentially opening the door to the $43,000 region.
Weekly Close Shows Fragility Despite $70K Rebound
Bitcoin found its way back to $71,000 as the week kicked off. However, most find this rally looking sketchy.
Sure, we saw a 7% bounce from last week’s $60,000 bloodbath, but there’s basically no volatility around the weekly close. And when things look too calm after a crash, traders get suspicious.
Trader CrypNuevo said on X: this whole move up looks like a calculated play to hunt down short positions stacked between $72,000 and $77,000.
If this “recovery” turns out to be fake, bears have one target in their crosshairs: $50,000.
Miner Costs and Stablecoin Flows Signal Caution
Here’s a number that should make you nervous: $67,000. That’s what it costs miners to produce one Bitcoin.
BTC might be trading below that soon. Historically, the miner production cost acts like a safety net, prices usually don’t stay below it for long.
if this continues, miners start going broke. And when miners capitulate? They dump their Bitcoin to stay alive, which creates even more sell pressure. It’s a vicious cycle.
While the fundamentals look grim, there’s a massive pile of cash sitting on the sidelines. Stablecoin inflows just doubled to $98 billion.
They’re ready to buy… they’re just waiting for the right moment.
Next Steps: Bitcoin Price Technical Levels to Watch
Traders are staring down at an interesting moment as inflation data drops this week. Right now, all eyes are on $67,350, that’s the support level holding this whole thing together.
If Bitcoin breaks below that? We’re looking at bearish flag patterns that could drag prices down to $50,000. Yeah, a potential 30%+ dive.
There’s a bullish scenario too. The magic number is $74,434. If BTC can reclaim and hold above that level, it kills the bearish setup and potentially opens the door back to $80,000.