
Crypto Journalist
Anas Hassan
Crypto Journalist
Anas Hassan
Share


Ethereum is trading at $3,616 after a -2.24% pullback with BlackRock’s iShares ETH ETF recording $17.65 million daily inflows while maintaining a bullish structure above all major EMAs, positioning ETH for a potential rebound toward $3,800 or a deeper correction testing the $3,400 support zone.
ChatGPT’s ETH analysis synthesizes 26 real-time technical indicators, ETF institutional flows, 10th anniversary developments, and ecosystem growth metrics to assess ETH’s 90-day trajectory amid key technical inflection between healthy consolidation and explosive breakout momentum.
Technical Analysis: Healthy Pullback Within Strong Bullish Structure
Ethereum’s current price of $3,616 reflects a -2.24% daily decline from $3,699, establishing a trading range between $3,725 (high) and $3,568 (low).
This controlled volatility demonstrates healthy correction within a strong uptrend structure.
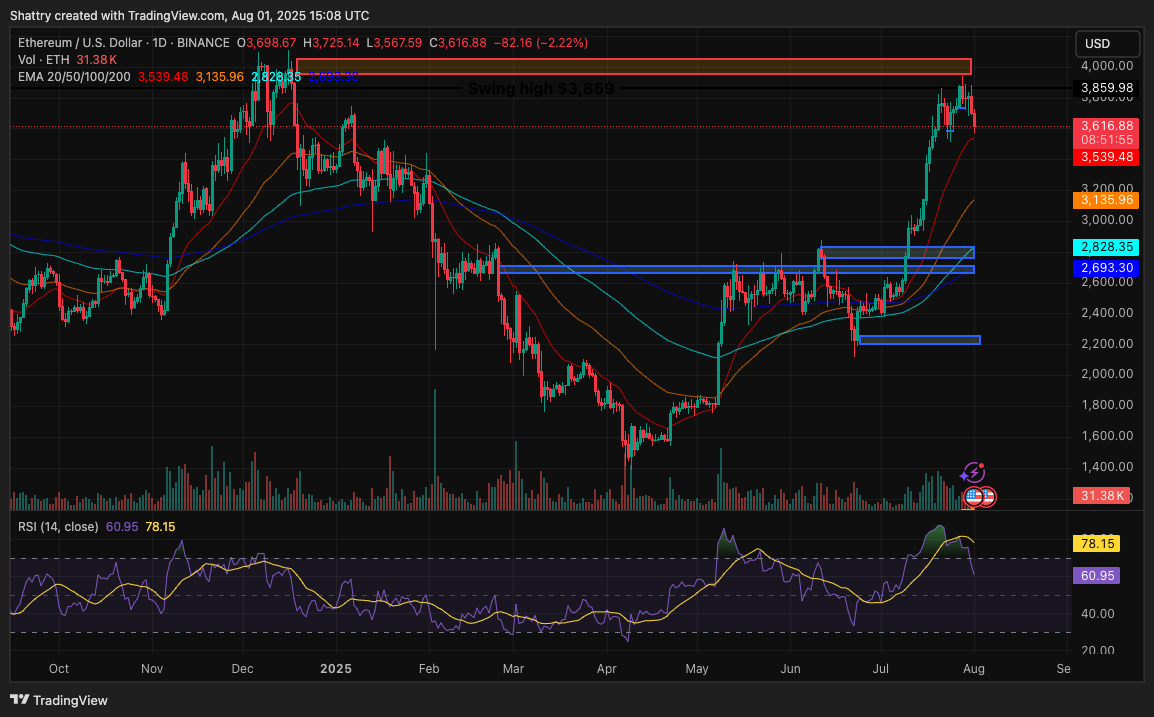
Moving averages reveal an exceptional bullish structure with ETH above all major EMAs: 20-day at $3,539 (+2.1%), 50-day at $3,136 (+13.3%), 100-day at $2,828 (+21.8%), and 200-day at $2,693 (+25.5%). This represents one of ETH’s strongest technical setups recently.
The RSI at 60.95 sits in neutral-bullish territory with substantial room for continued upward movement. MACD shows mixed signs at -35.25, but a positive histogram at 270.03 suggests building momentum despite bearish positioning.
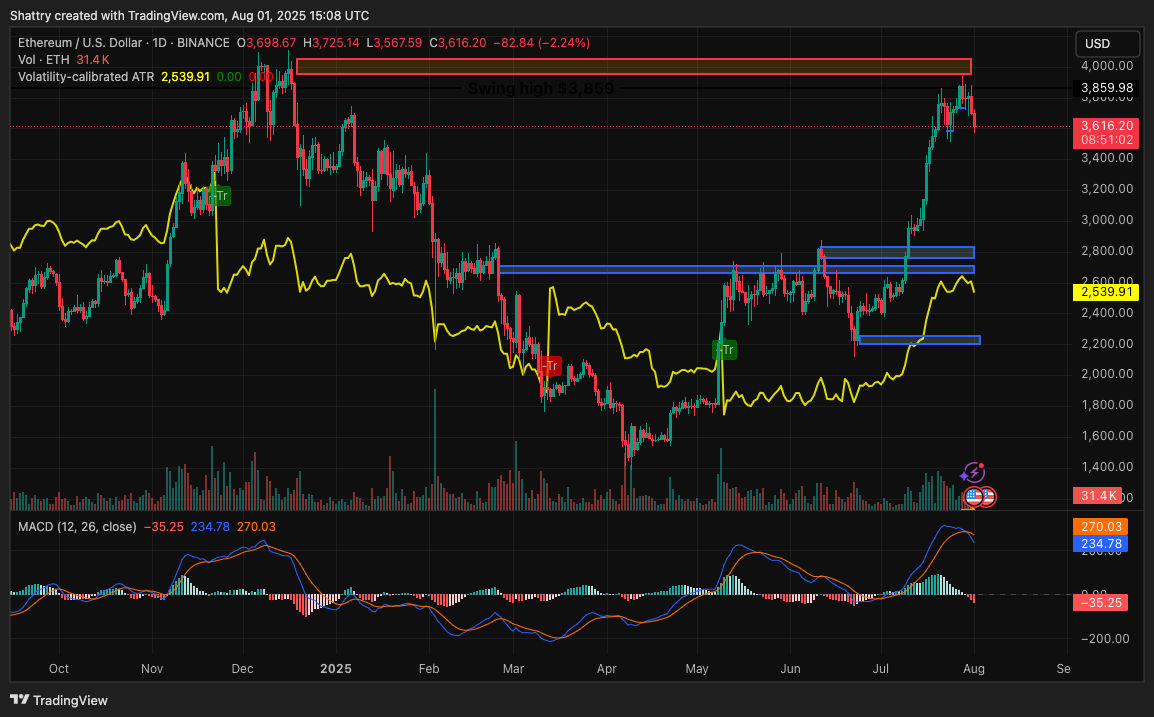
Volume at 31.4K ETH indicates steady institutional participation, while ATR at 2,540 suggests a high volatility environment with potential for massive moves once consolidation resolves.
Historical Context: Explosive Recovery from Spring Correction
Ethereum’s 2025 performance demonstrates strong resilience with explosive recovery from April’s $1,385 low to current consolidation above $3,600.
This 168%+ appreciation showcases fundamental strength and institutional confidence.
January-March correction from $3,298 to $1,823, followed by April’s decline to $1,500, established institutional accumulation opportunities. The decisive spring bottom marked the foundation for explosive recovery momentum.
May-July recovery showed consistent strength with ETH rebounding from $1,700 to $3,650 in June, continuing toward current levels.
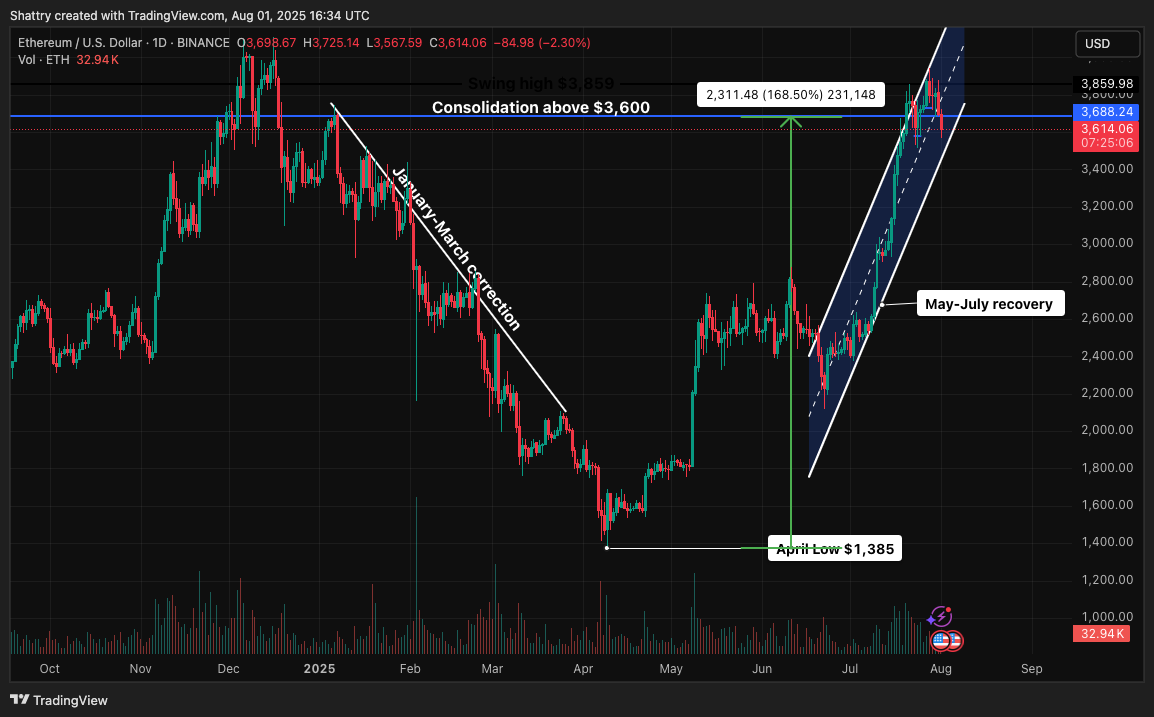
This 51.84% monthly gain represents Ethereum’s strongest performance since 2022.
Current pricing sits 25.75% below all-time high while maintaining extraordinary 862,000%+ gains from 2015 lows, showing both remaining upside potential and proven institutional-grade appreciation capacity.
Support & Resistance: Multiple Strong EMA Support Layers
Immediate support emerges at today’s low around $3,568, reinforced by the key 20-day EMA at $3,539.
This confluence provides primary defense with multiple EMA layers, creating exceptional downside protection.
Key support demonstrates strong depth with 50-day EMA at $3,136 (+13.3% buffer), 100-day EMA at $2,828 (+21.8% buffer), and 200-day EMA at $2,693 (+25.5% buffer).
Resistance begins at today’s high around $3,725, followed by psychological resistance at $3,800-$3,900.
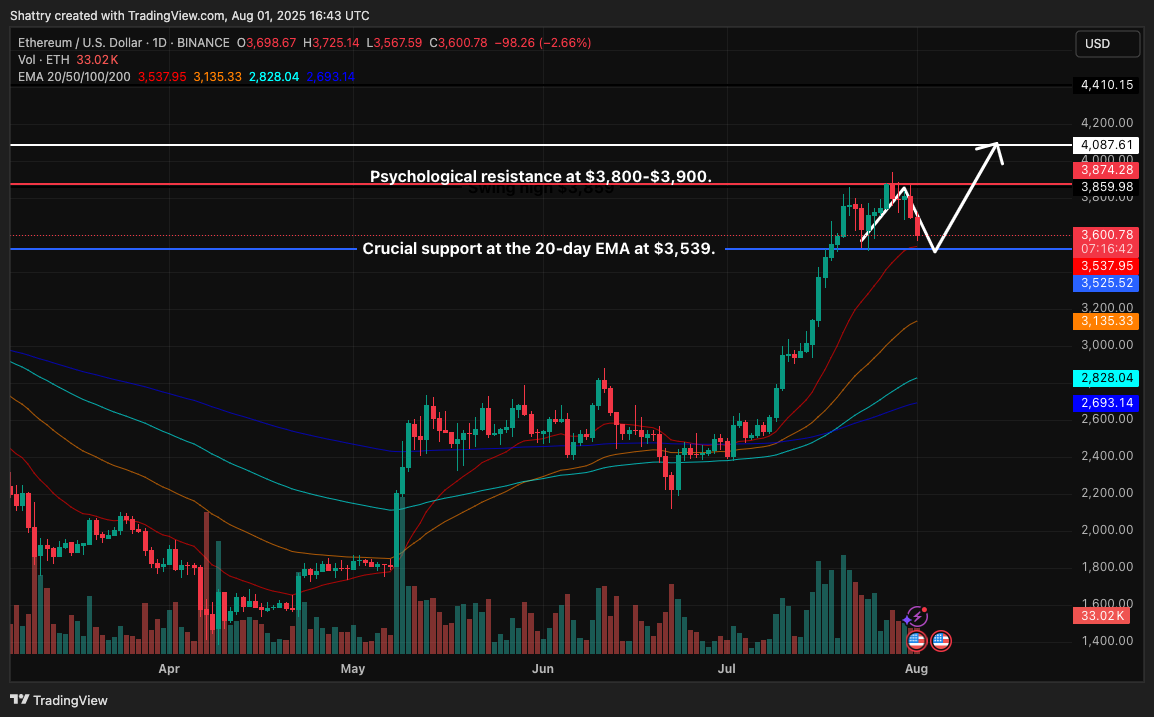
Major resistance emerges at $4,000-$4,100, where previous cycle highs create overhead pressure requiring substantial volume.
The setup suggests pullbacks would find multiple support levels, while a breakout above $3,725 could trigger rapid appreciation toward $3,800-$4,000 based on ETF momentum.
ETF Breakthrough: BlackRock Leads Institutional Adoption
BlackRock’s iShares Ethereum ETF recorded exceptional $17.65 million daily inflows, contributing to total ETF net flows of $29.83 million across nine Ethereum ETFs.
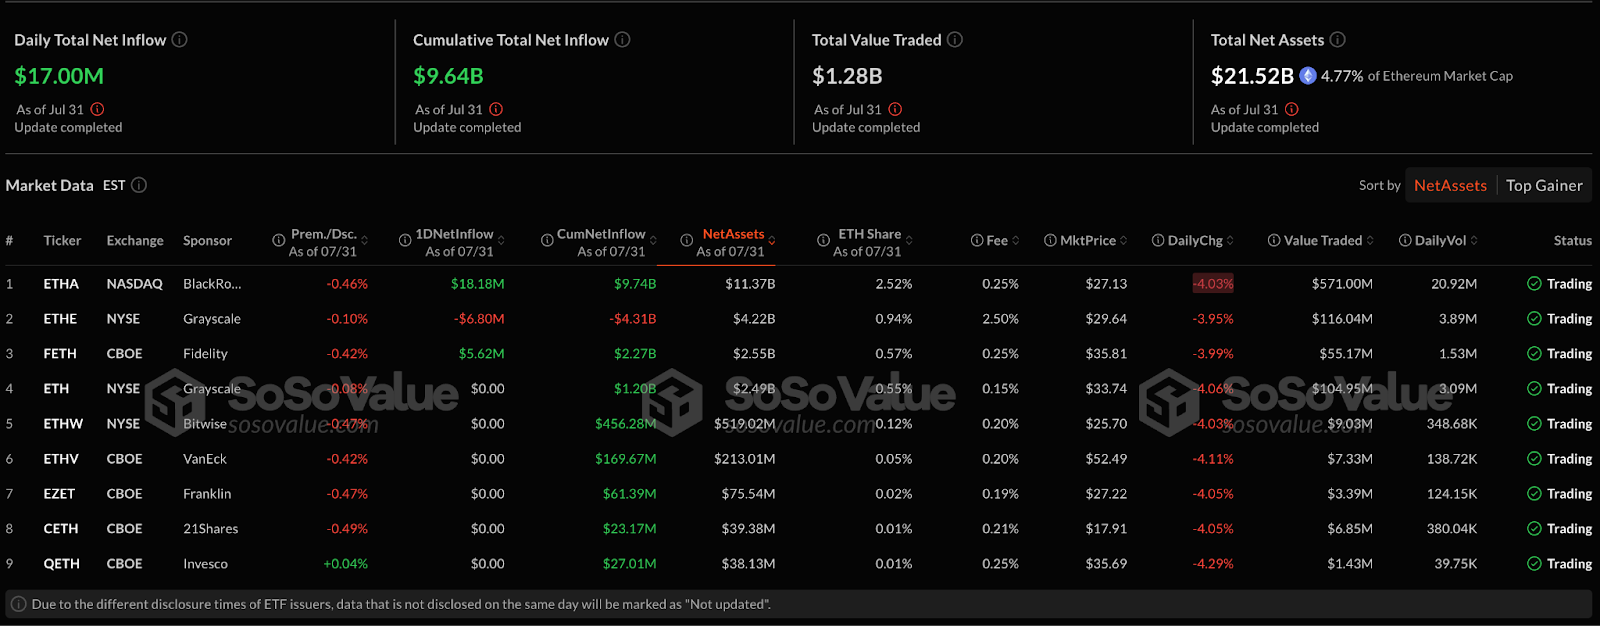
This represents unprecedented mainstream institutional adoption.
The ETF momentum shows sustained institutional appetite with BlackRock holding 3.03 million ETH valued at $11.04 billion.
This represents 2.5% of the total ETH supply, creating significant supply reduction pressure.
Ethereum ETFs are experiencing their longest inflow streak ever, contrasting sharply with Bitcoin ETF outflows of $109.845 million.
This rotation reflects institutional recognition of ETH’s superior utility.
Market Fundamentals: Strong Metrics Despite Pullback
Ethereum maintains its position as the second-largest cryptocurrency with $438.45 billion market cap, demonstrating institutional validation.
The 3.56% market cap increase accompanies an exceptional 19.36% volume surge to $43.28 billion.
The 9.57% volume-to-market cap ratio indicates exceptional trading activity.
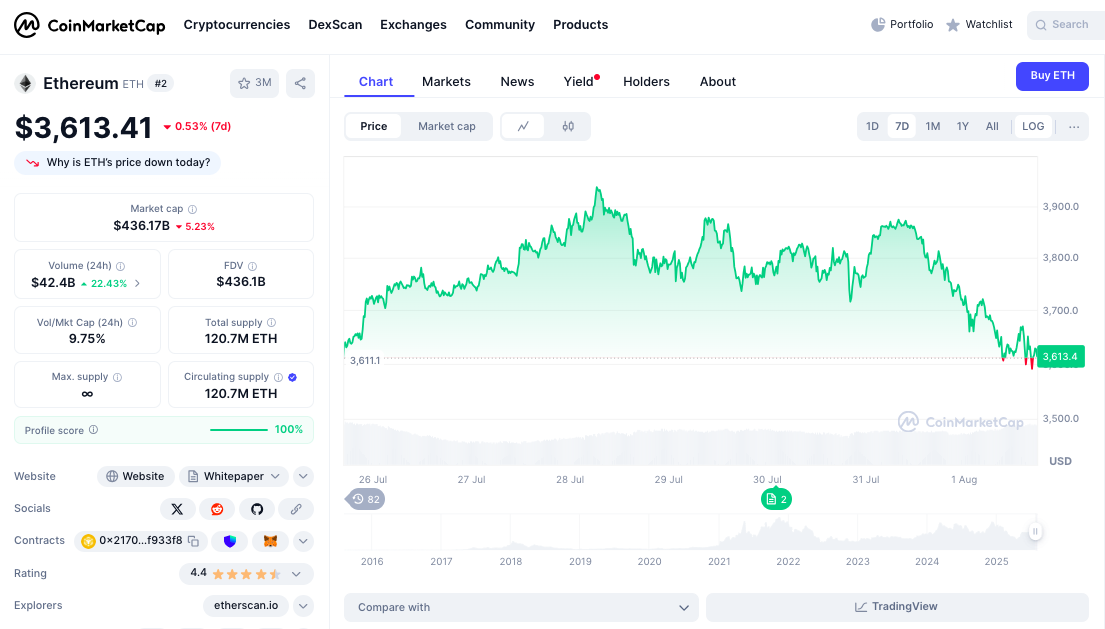
Circulating supply of 120.7 million ETH reflects deflationary tokenomics through EIP-1559 fee burning.
Market dominance of 11.85% positions Ethereum as a major institutional-grade cryptocurrency.
Ecosystem Milestones: 10th Anniversary Catalysts
Ethereum’s 10th anniversary coincides with a proposed 10-year “lean” roadmap targeting 10,000 transactions per second and simplified technical complexity.
This addresses scalability while maintaining decentralization principles.
The ecosystem shows exceptional growth with DApp usage surging and treasury surpassing $10 billion.
LunarCrush data reveals solid social performance with Ethereum’s AltRank at 121, indicating strong community engagement.
Galaxy Score of 66 reflects building positive sentiment around institutional developments and anniversary celebrations.
Engagement metrics show substantial activity with 40.11 million total engagements, 203.25K mentions, and 44.6K creators contributing to discussions.
Social dominance of 13.8% demonstrates substantial attention relative to market position.
Sentiment registers at robust 83% positive, reflecting optimism around ETF inflows, anniversary developments, and institutional partnerships.
Recent themes focus on ETH outperforming Bitcoin and $8,000 price predictions.
Three-Month ETH Price Forecast Scenarios
ETF-Driven Institutional Breakout (50% Probability)
Continued ETF inflows combined with anniversary momentum could drive explosive appreciation toward $5,000-$6,000, representing 40-65% upside from current levels.
This scenario requires sustained volume above 50K ETH daily and a successful break above $3,800 resistance.
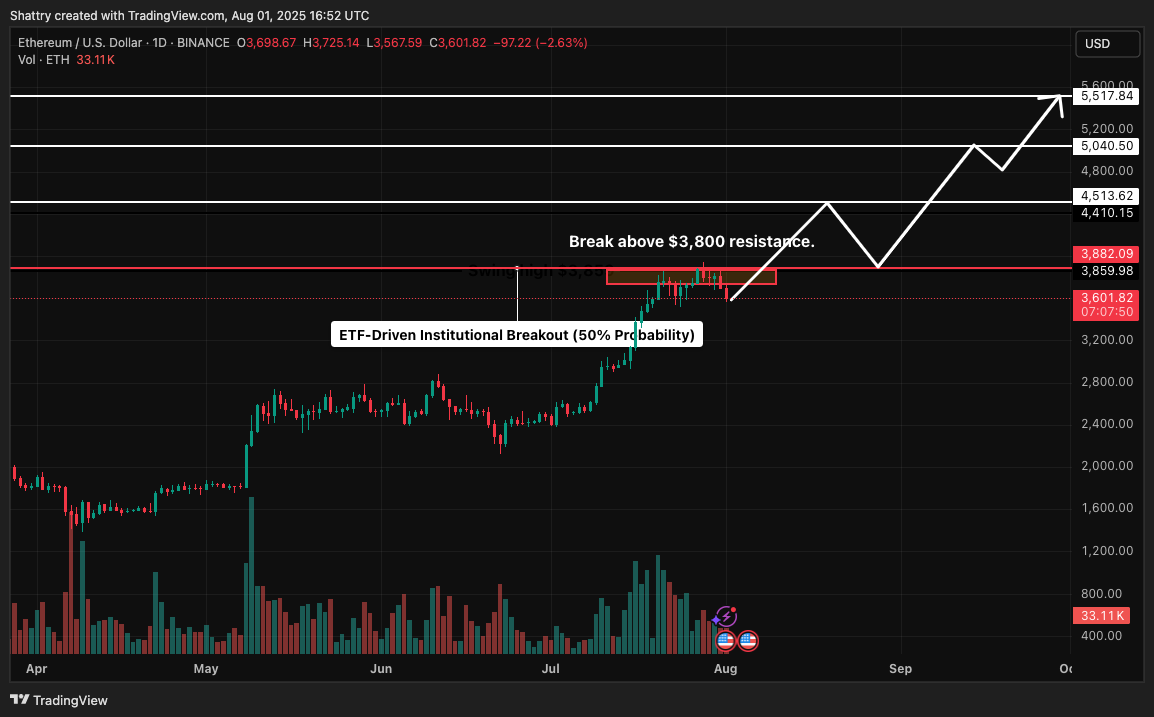
Technical targets include $4,000, $4,500, and $5,500 based on historical resistance levels and institutional flow projections.
Extended Consolidation (30% Probability)
Broader market uncertainty could result in extended consolidation between $3,200-$3,800, allowing technical indicators to reset while institutional positioning continues.
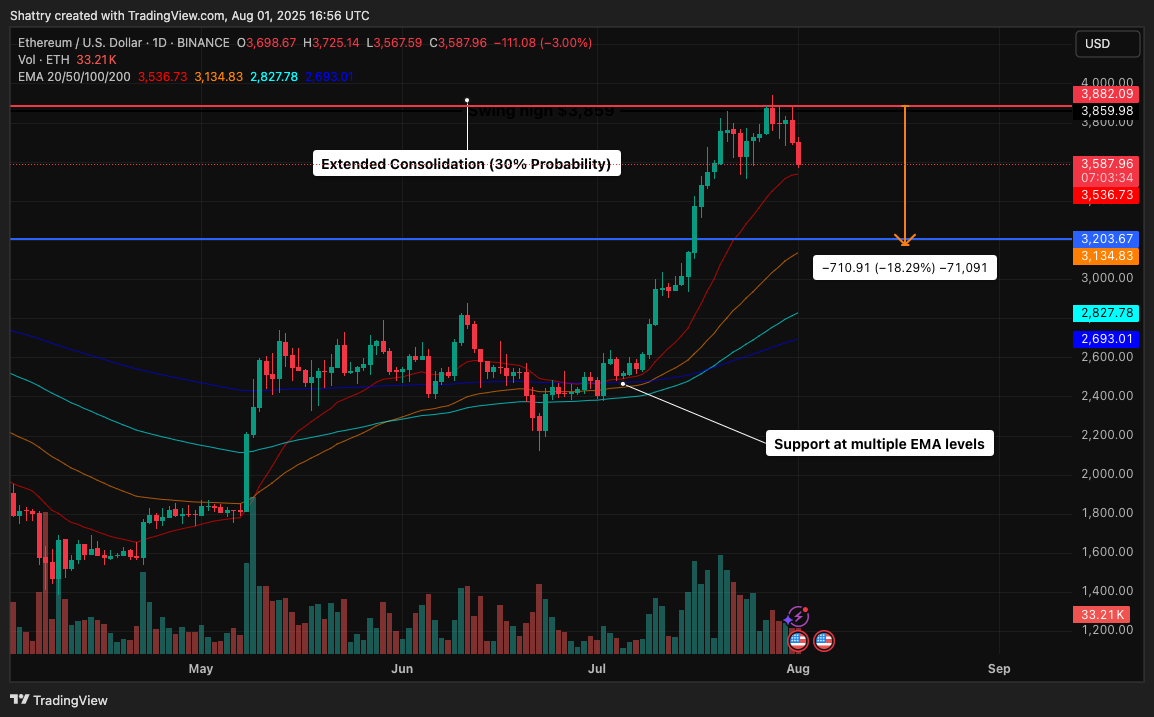
Support at multiple EMA levels would likely hold during consolidation, with volume normalizing around 35-40K ETH daily.
This sideways action could extend 6-10 weeks pending major catalyst developments.
Correction on Market Weakness (20% Probability)
Broader crypto market weakness could trigger selling toward $3,100-$3,400 support levels, representing 10-15% downside from current levels.
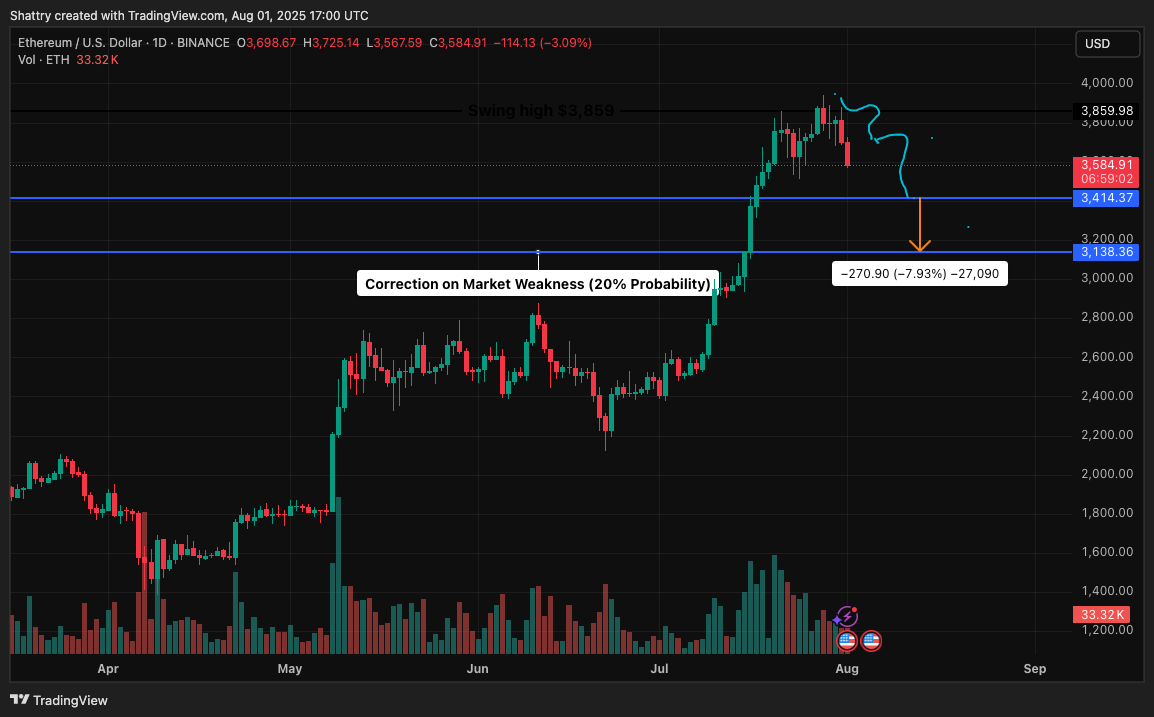
Recovery would depend on ETF buying at lower levels and continued institutional adoption through dip-buying opportunities.
ChatGPT’s ETH Analysis: Institutional Validation Meets Technical Strength
Ethereum’s positioning reflects unprecedented convergence of institutional validation through ETF adoption, technical strength above all EMAs, and ecosystem milestone momentum.
Next Price Target: $5,000-$6,000 Within 90 Days
The immediate trajectory requires decisive recovery above $3,725 resistance to validate continued institutional momentum over healthy consolidation.
From there, ETF adoption acceleration could propel Ethereum toward $5,000 psychological milestone, with sustained institutional flows driving toward $6,000+, representing new cycle preparation highs.
However, failure to reclaim $3,725 would signal extended consolidation to $3,400-$3,600 range as the market experiences profit-taking.