Share

Jump into the latest crypto price prediction Today for February 24, and discover the latest analysis for Bitcoin (BTC), Ripple (XRP), and Ethereum (ETH)
XRP is currently trapped in a brutal seasonal downtrend, shedding over 30% of its value this month in a move that bears are calling the return of the “February Curse.” The token has slid from its monthly open near $2.05 to test precarious support at $1.40, marking one of its worst starts to a year in recent history.
But this correction is colliding with a massive wall of institutional money. Data reveals over $1.3 billion in cumulative inflows into XRP investment products since late 2025, creating a high-stakes battle between historical weakness and unprecedented demand.
Key Takeaways
- The Curse: XRP is on track for its fifth consecutive red monthly candle, down 30% in February alone.
- The Counter-Force: XRP ETF inflows and investment products have attracted $1.3 billion despite the price slump.
- The Battleground: Bulls must hold $1.40 support to stage a recovery attempt toward the critical $2.00 resistance level.
XRP’s February Curse: What the Historical Data Shows
The sellers are undeniably in control of the short-term trend. XRP has dropped approximately 30% from its February highs, a decline that extends a painful streak of losses beginning in October 2025. This marks a potential fifth consecutive red monthly candle—a rarity in crypto market analysis not seen since the prelude to the 2017 bull run.
Historically, February has plagued the asset. For nine of the last ten years, XRP has underperformed Bitcoin during this month. The current slump to $1.40 has pushed the Relative Strength Index (RSI) down to 37.82, a level that signals extreme oversold conditions but offers no guarantee of a reversal.
If the $1.40 floor gives way, technical damage could compound quickly. A breakdown below this level opens the door to a retest of $1.30, a zone that has not been visited since the post-SEC settlement rally began.

Why $1.3B in Institutional Inflows Could Change Everything
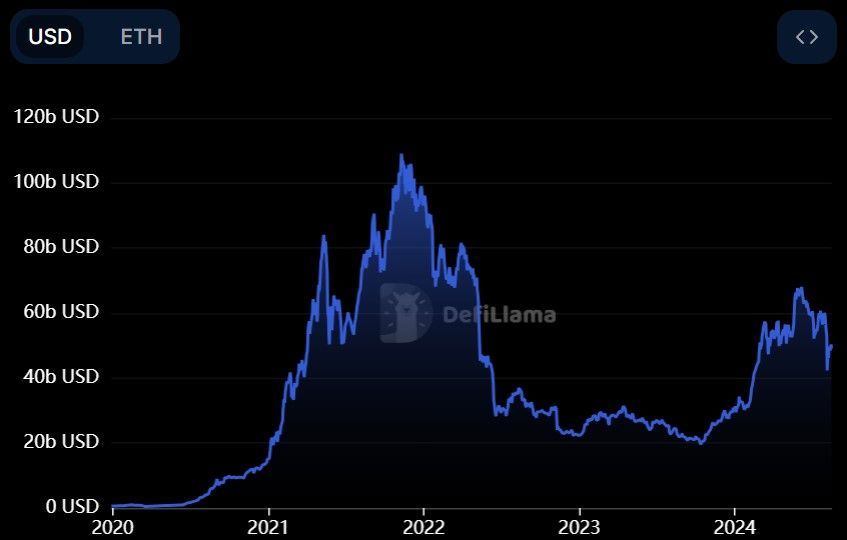
While price action looks grim, the flow of money tells a completely different story. Since the launch of U.S. spot XRP ETFs in November 2025, investment products tied to the asset have absorbed over $1.3 billion in cumulative inflows. This buying streak has persisted for over 40 consecutive days, showing remarkable resilience even as the spot price tumbled.
This is where the narrative diverges from the broader market. While spot Bitcoin ETFs log their fifth straight week of outflows, institutional capital is actively rotating into XRP. This suggests that smart money views the current dip not as a trend reversal, but as a discount accumulation window.
The divergence is unmistakable.
Typically, altcoins bleed faster than Bitcoin during market corrections. Yet, the sustained XRP ETF inflows suggest high-net-worth investors are betting on a distinct decoupling. If this institutional demand continues to absorb retail selling, the specific supply shock could trigger a violent reversal once sell-side exhaustion hits.
XRP Price Prediction: Can $2.00 Break the Curse?
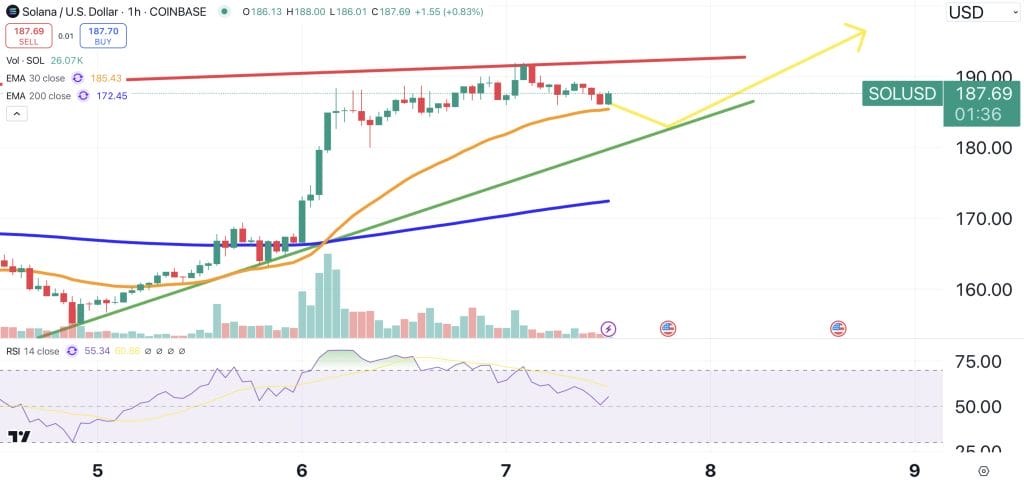
Traders are now watching the $1.40 level with intense focus. This price point serves as the line in the sand for the current XRP price prediction models. Consolidating around this baseline, price action has formed a falling wedge—typically a bullish reversal pattern, provided support holds.
Prominent analyst Crypto Bull recently noted that while moonshot targets like $10,000 are unsupported by current charts, technical structures do make a case for a rally toward $28 in the longer term. However, the immediate battle is for $2.00.
If XRP can reclaim $1.60 on high volume, it invalidates the immediate bearish breakdown. That clears the path for a run at $2.00, the psychological barrier that defines the asset’s medium-term trend. A confirmed breakout above $2.00 would effectively end the “February Curse” narrative.

Conversely, failure here would be costly. If bears force a daily close below $1.38, the bullish wedge structure invalidates. That scenario likely triggers a liquidation cascade targeting the $1.05 region.
Record Accumulation: A Fundamental Shift or Temporary Noise?
Is this time actually different? The institutional crypto landscape has shifted dramatically since the 2017 or 2021 cycles. The introduction of regulated ETFs provides a sticky capital base that didn’t exist during previous February slumps. Furthermore, utility-driven adoption is accelerating alongside speculation.
Just this week, SBI Holdings launched a 10 billion yen blockchain bond with XRP rewards, further cementing the asset’s role in institutional finance. Developments like these provide fundamental ballast to the price, arguing that the $1.3 billion inflow is a long-term strategic allocation rather than short-term speculation.
This structural change implies that the current correlation with Bitcoin’s weakness may be temporary. While recent strange AI models predict wild variance for the asset by year-end, the immediate on-chain reality shows exchange balances plummeting as ETFs scoop up supply.
What Does This Mean for XRP Price?
The market is approaching a decision point. For the bulls to win, XRP needs to close February above $1.60. Achieving this would print a massive wick on the monthly candle, signaling a rejection of lower prices and setting the stage for a green March.
However, if the price languishes below $1.40 into the monthly close, the “February Curse” will be confirmed as a self-fulfilling prophecy. In that scenario, traders should brace for a potentially volatile flush to $1.25 before the institutional bid wall steps in again.