Author
Jimmy Aki
Author
Jimmy Aki
Share


Curve DAO’s native token $CRV rebounded this week, with about a 79% rally as it climbed from a weekly low of $0.6017 and is trading at $0.9882 at press time, also marking a 22.9% increase in the last 24 hours.
Despite occasional profit‑taking around mid‑week, $CRV’s renewed momentum indicates robust buying interest ahead of key governance votes and protocol upgrades.
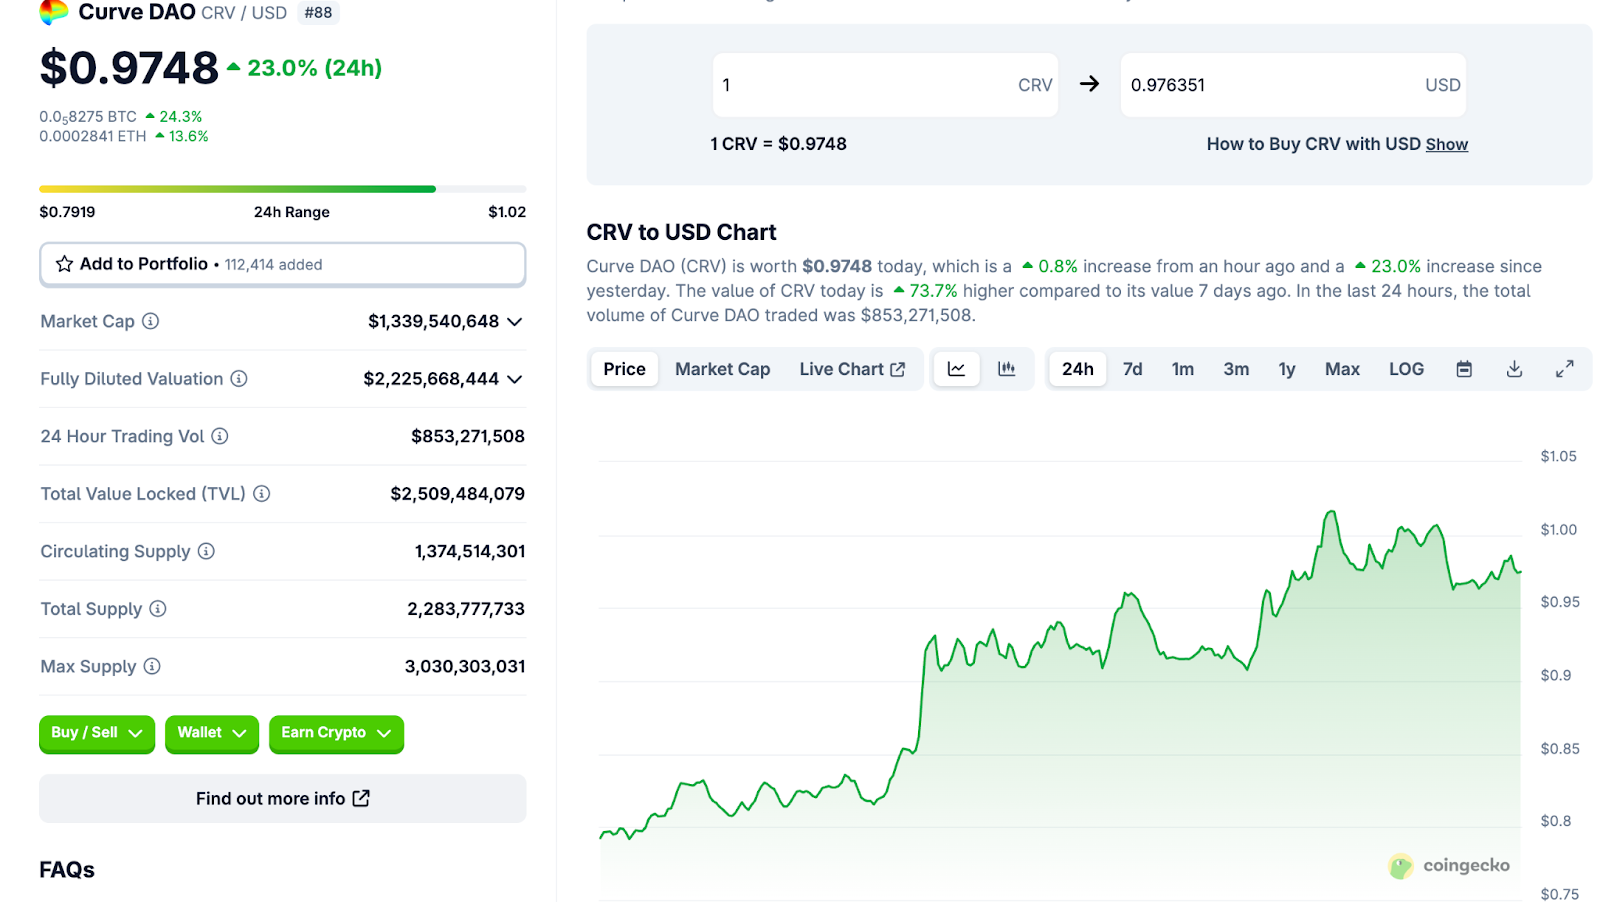
On-chain analytics show $CRV trading volume has surged to $848.37 million in the last 24 hours, indicating heightened trader activity. With a market capitalization of $1.33 billion, $CRV is ranked among the top DeFi governance tokens by market cap.
The $CRV token is central to Curve’s governance and rewards model. With a total supply of 2.28 billion $CRV tokens and 93,828 active holders, the token shapes the DAO’s decisions.
Users who lock $CRV via vote-escrow (veCRV) gain increased governance influence and boosted liquidity incentives, underpinned by the DAO’s decentralized governance framework.
Analysts have also pointed out Curve’s engaged community and governance model as key drivers for sustained growth.
Curve’s Total Value Locked (TVL) stands at approximately $2.49 billion across supported chains, according to DeFiLlama, illustrating its robust liquidity depth in DeFi.
Strategic integrations with major DeFi platforms such as Yearn Finance, Compound, and Aave have expanded Curve’s interoperability and revenue streams.
The protocol also launched on Polyhedra’s EXPchain, allowing low-cost, cross-chain stablecoin swaps and expanding liquidity reach.
June’s protocol update introduced a dedicated DAO Treasury, a refreshed Llamalend UI, and the Block Oracle to enhance cross-chain messaging for future upgrades.
$CRV/$USDT—Explosive Breakout From Base With Intensifying Buyer Flow
The 4‑hour price chart of $CRV shows an explosive rally emerging from a long basing structure, with price moving from the $0.50 region into the $0.97–$0.99 area in a near‑vertical advance.
The broader structure prior to this move was one of consolidation, with repeated attempts to break above the $0.66–$0.70 resistance cluster that had failed in June. A breakout above this level ignited a sustained uptrend.
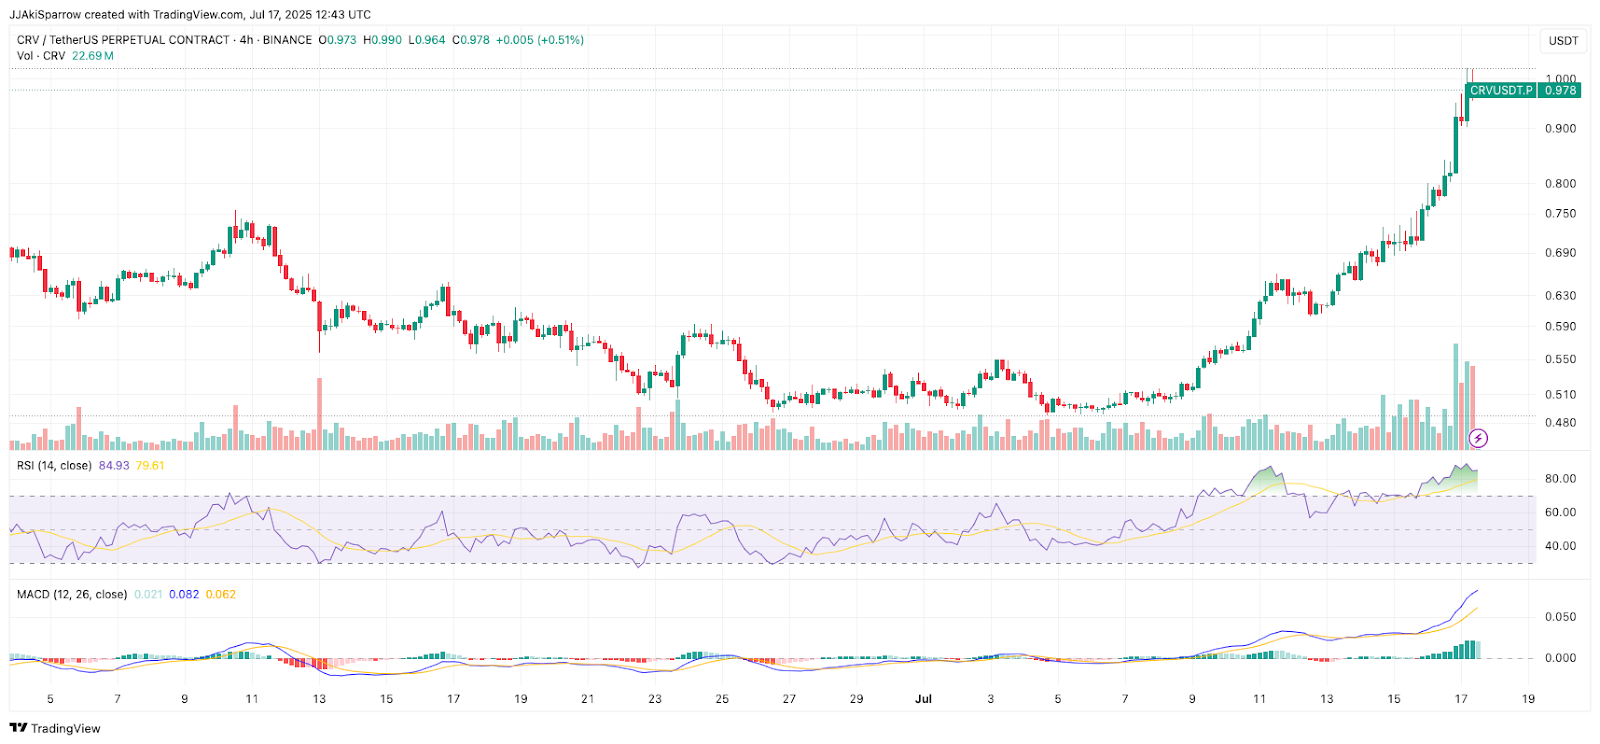
Successive higher highs and higher lows are visible, and the most recent candles show extended green bodies accompanied by expanded volume, a sign of aggressive participation driving the market higher.
There is little in the way of overhead supply visible on this timeframe until the symbolic $1.00 level, which the price has now tested intraday, suggesting a psychological barrier that could act as either resistance or a staging point for further upside.
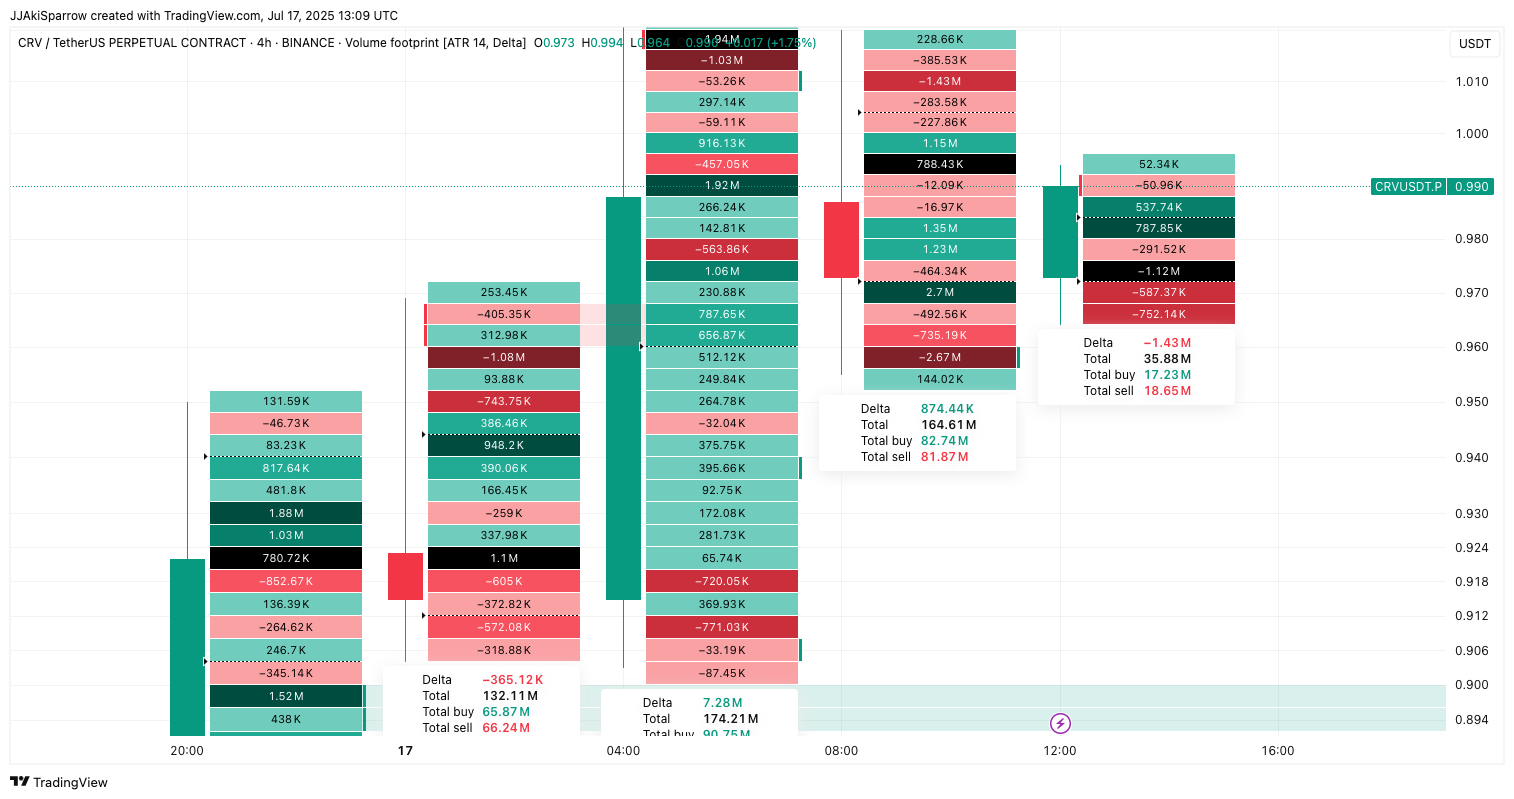
The volume footprint data aligns with the intensity of this move.
During the breakout phase, several bars show strong positive deltas, such as an 874.44k net delta on heavy volume. This indicates that market participants were aggressively lifting offers and absorbing any remaining liquidity.
This is coupled with another footprint candle posting a positive delta of over 1.52 million earlier in the chart, reinforcing the picture of buyers dominating the order flow.
However, within or between these bullish imbalances are pockets of absorption and heavy selling, including a large bar showing a negative delta of 1.43 million, where 18.65 million in selling overcame 17.23 million in buying within that period.
It is logical to suggest here that while buyers have been in control overall, sellers are beginning to step in more assertively near the highs.
Taken together, the price structure and footprint activity point to a market that has broken out from compression and is now testing areas where profit-taking and counter-order flow are more likely to occur.
The $1.00 mark is the one to beat. A solid close above it, backed by strong buying pressure, would open the path toward $1.05 and beyond.. On the flip side, the $0.94–$0.96 zone is where things could go downward really fast.
A breakdown through that zone would indicate that sellers have gained traction and could trigger a retracement back toward the prior breakout area near $0.88.
The interplay of sustained buying pressure and emerging sell‑side responses makes the next move from these levels especially important.