
Content Writer
Harvey Hunter
Share

Most derivative traders are positioned for further downside, but that crowded positioning may be exactly what fuels the next upside move for bullish Solana price predictions.
On the seven-day liquidation heatmap, the altcoin faces nearly twice as much potential short-side liquidation as long-side exposure.
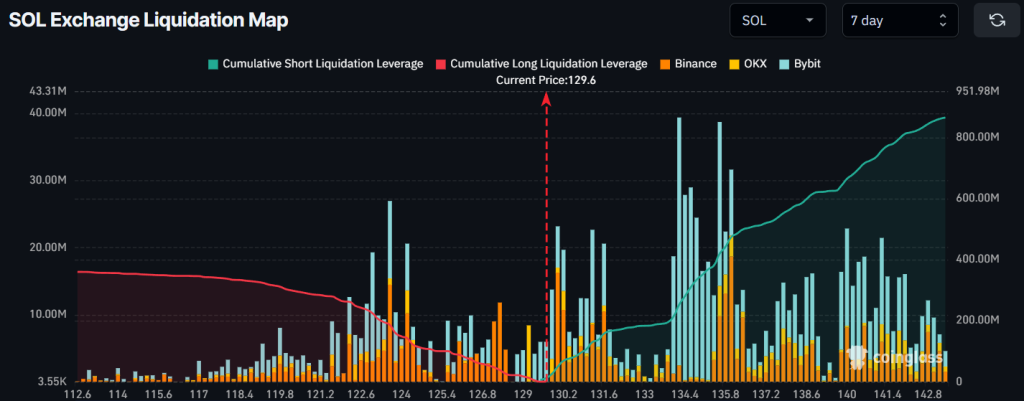
That imbalance creates a clear scenario. If SOL pushes up to $147 this week, short sellers could face up to $1 billion in liquidations, forcing them to buy back positions and accelerate the move higher.
But that volatility goes both ways. While long-side exposure is smaller, a drop below $120 could still trigger a $500 million long squeeze and spark a sharp liquidation cascade.
Still, fundamentals place the pressure on short traders this week.
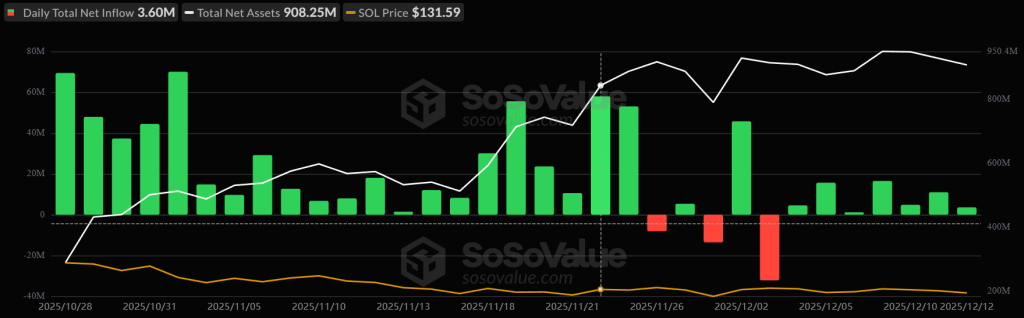
TradFi markets appear more firm in their positioning, with Spot SOL ETF on a 7-day inflow streak. While inflows have slowed, the trend suggests conviction in potential upside.
Broader narratives also support bullish sentiment, including XRP expanding DeFi use cases on Solana through Hex Trust and a partnership with Project Eleven to advance post-quantum security.
Solana Price Prediction: Short or Long Squeeze
There is also a technical argument for a short-squeeze scenario: a strong confluence of support acting as a barrier to further downside at $120.
The level marks the base of a triple bottom reversal structure. And with a potential higher low forming on its latest bounce, buyers appear to be stepping in sooner than they did on recent drops.
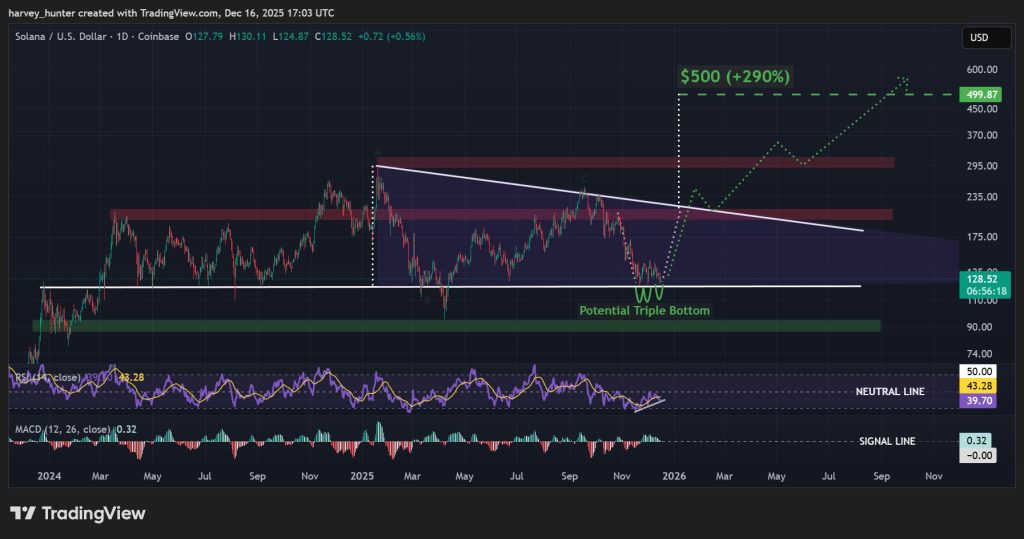
The setup is highly bullish, and momentum indicators back it.
The RSI continues to print higher lows as it trends toward the 50 neutral line, signalling growing buy pressure beneath the surface.
At the same time, the MACD is holding just above a potential death cross with the signal line, a sign that current levels are pivotal for the prevailing trend.
The $120 level also marks the lower boundary of a year-long descending triangle pattern, with the $210 target of the triple bottom setting up a breakout attempt.
In a breakout scenario, the triangle would target a potential 290% move to $500.
SUBBD: A Staple For the Next Bull Run?
As easing market FUD pits narratives grounded in real-world utility back into focus, platforms like SUBBD ($SUBBD) are attracting serious attention.
Built as an AI-powered content platform, SUBBD is targeting the $85 billion subscriber economy by giving creators true ownership and fans genuine access – the pitfall of legacy platforms.
By removing middlemen, $SUBBD puts value back where it belongs.
Creators can monetize their audiences directly, and fans gain entry to exclusive content, early releases, and deeper engagement through token-gated experiences.
Momentum is already forming. The presale has raised nearly $1.4 million, and even a modest slice of the broader creator economy post-launch could translate into meaningful upside.
With SUBBD, both sides of the community win.
Creators earn more, and fans get closer while embracing the decentralization use cases crypto was built for.
Visit the Official SUBBD Website Here