
Journalist
Sead Fadilpašić
Journalist
Sead Fadilpašić
Share


The crypto market is up today, with the cryptocurrency market capitalisation increasing by 2.6%, now standing at $3.62 trillion. Nearly all of the top 100 coins have risen over the past 24 hours. At the same time, the total crypto trading volume is at $136 billion.
TLDR:
Crypto Winners & Losers
At the time of writing, all of the top 10 coins per market capitalization have seen their prices increase over the past 24 hours.
Bitcoin (BTC) has appreciated by 4.3% since this time yesterday, currently trading at $106,253.
Ethereum (ETH) is up by 5.7%, now changing hands at $3,606. This is the second-highest increase in the category.
The highest rise in the category is 8.7% by XRP, now trading at $2.48.
Among these, Tron (TRX) saw the smallest increase, recording a 1.3% rise to the price of $0.2936.
Looking at the top 100 coins, three saw double-digit rises. Pump.fun (PUMP) is up 15.4% to $0.004402, followed by Zcash (ZEC)’s 15.3% to $662.97.
The third one is Uniswap (UNI), which saw an increase of 14.3%, now standing at $6.74.
On the other hand, Internet Computer (ICP) is the only red coin, having dropped 9.8% to $7.14.
Meanwhile, the US Senate advanced a deal on Sunday to reopen the federal government, funding operations through 30 January 2026. The shutdown has had its influence on the crypto market as it tightened liquidity and increased volatility.
Therefore, a resolution would be beneficial for the markets across the board, but any issues could prolong the volatility.
BTC May Drop to $70K-$80K in Q2 2026
John Glover, Chief Investment Officer of Ledn, argued that “BTC prices continue to come softer as expected.”
That said, he highlights that there is typically “a fair bit of volatility” as tops or bottoms form. Therefore, he says, “don’t expect a quick unidirectional move lower in BTC.”
Glover expects that we will see the low in the $71,000 to $84,000 region reached sometime towards the second half of 2026 (the yellow line in the chart below).
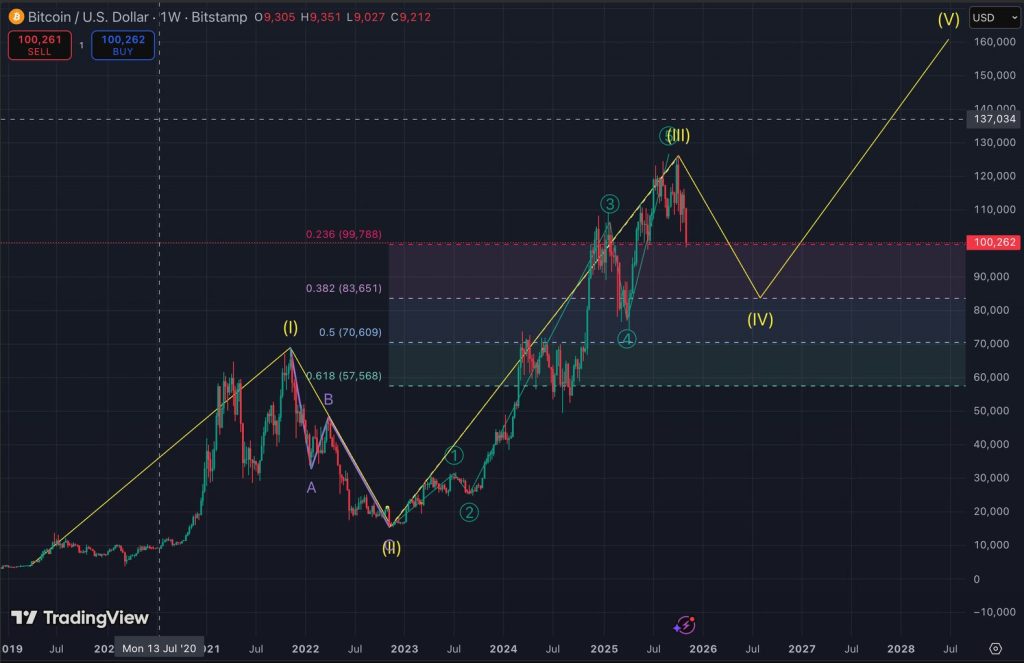
One of the key 4th wave targets is the 23.6% Fibonacci retracement, which sits at $99,000, he continues. “We have yet to close below that level, so this is where I expect the first bounce.”
“While some feel strongly that the 23.6% support will hold, I expect Wave IV to be quite complex, with lots of rallies and sell-offs, eventually hitting the 50% to 38.2% retracement levels ($71k and $84k respectively),” Glover concluded.
Moreover, according to Glassnode analysts, realized losses suggest capitulation among recent BTC buyers.
Levels & Events to Watch Next
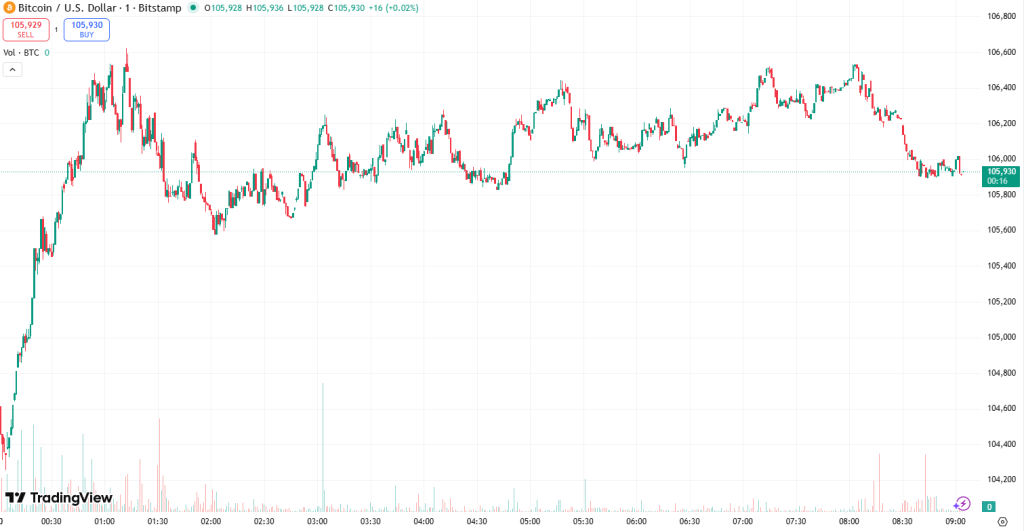
At the time of writing on Monday morning, BTC trades at $106,253. The charts show a clear and gradual increase from the intraday low of $101,546 to the intraday high of $106,488.
While green on the daily front, the coin is red in the weekly and monthly timeframes. It’s down 1.4% over the past 7 days and 4.9% over the last 30 days. It’s also 16% below its all-time high of $126,080 seen a month ago.
Sustaining the price above $106,000 could see BTC move over $110,000. This would open doors for further rallies. On the other hand, falling below $103,200 may lead to the $100,000 level and a decline toward the $98,000-$95,000 zone.
Ethereum is currently changing hands at $3,606. Like BTC, ETH recorded a notable increase from the day’s low of $3,384 to the high of $3,647. It hasn’t corrected much since.
Over the past week, the price moved between $3,162 and $3,727. Overall, the coin is down 3.2% in a week and 6% in a month. Also, it’s 27.4% away from the August ATH of $4,946.
The current key resistance zones stand at $3,783, $4,231, and $4,549. A break above $3,800 could result in a bullish move toward $4,200 and higher. But a failure to hold above $3,300 may lead the coin to retest the support levels around $3,050.
Meanwhile, Ethereum network fees have plunged to some of their lowest levels in years.
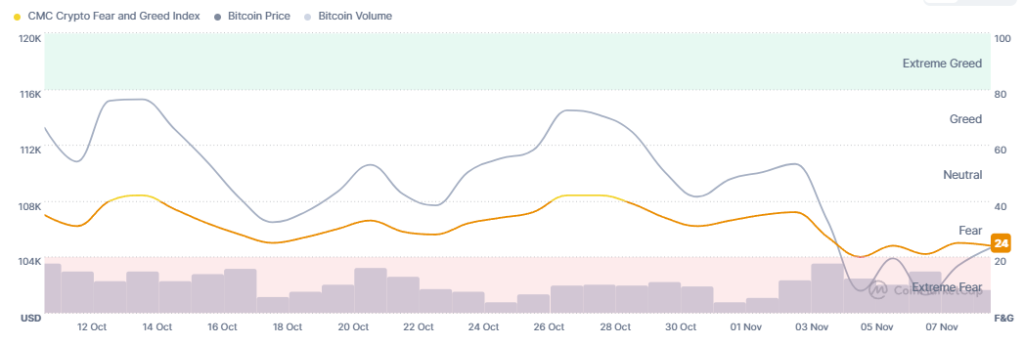
Moreover, the crypto market sentiment has stayed within the fear zone since the beginning of this month. The crypto fear and greed index stands at 24 today, somewhat higher than Friday’s 21, but still relatively close to the ‘extreme fear’ level.
Except for the first third of October, the rest of that month and the first ten days of November have been spent in the neutral and the fear zones.
It is clear that fear is leading the market and pulling the prices down. Investors selling their crypto can lead to higher selling pressure and volatility. That said, it’s also creating buying opportunities for the hodlers.
ETFs Return to Negative Flows
The US BTC spot exchange-traded funds (ETFs) resumed the red performance, following a single day of inflows. On Friday, it recorded $558.44 million in outflows, a level similar to Tuesday’s. The total net inflow fell to $59.97 billion.
Five of the 12 ETFs saw outflows. There were no inflows. Fidelity is at the top of the red list with $256.66 million, followed by Ark&21Shares’ $144.24 million and BlackRock’s $131.43 million.

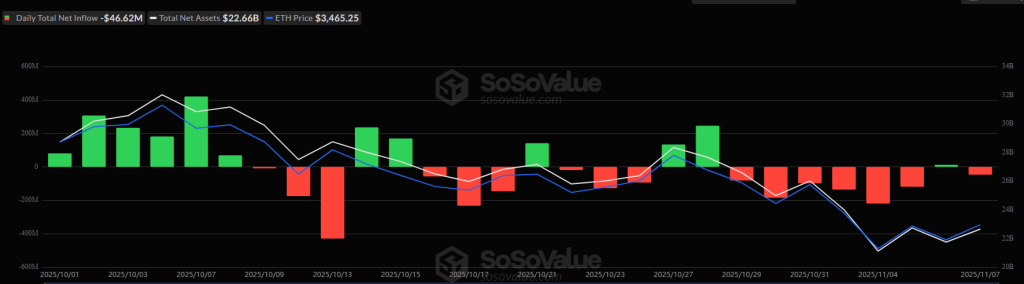
Same as the BTC ETFs, the US ETH ETFs saw one day of positive flows on Thursday, breaking an outflow streak, but it turned back to red on Friday with $46.62 million in inflows. The total net inflow now stands at $13.86 billion.
Unlike BTC ETFs, two of the nine funds saw positive flows, and two saw outflows. BlackRock and Invesco took in $34.43 million and $2.59 million, respectively. At the same time, Fidelity and Grayscale let go of $72.23 million and $11.42 million, respectively.
Meanwhile, the US spot Bitcoin ETFs have recorded a net outflow of $1.22 billion in the past week – the third-largest ever recorded.
This follows ongoing market volatility and macroeconomic pressures.
Quick FAQ
- Why did crypto move against stocks today?
The crypto market has increased over the past day, and the stock market saw a mixed picture during work hours on Friday. By the closing time on 7 November, the S&P 500 was up by 0.13%, the Nasdaq-100 decreased by 0.28%, and the Dow Jones Industrial Average rose by 0.16%. The US government shutdown continues to affect the markets. The October jobs report didn’t go out on Friday again. This data is useful to investors who are looking for signals on the Federal Reserve’s next interest rates move.
- Is this rally sustainable?
The US Senate advanced a deal on Sunday to reopen the federal government. Investors are now keeping a close eye on the developments, as successful reopening would ease the volatility and benefit the crypto marker overall.